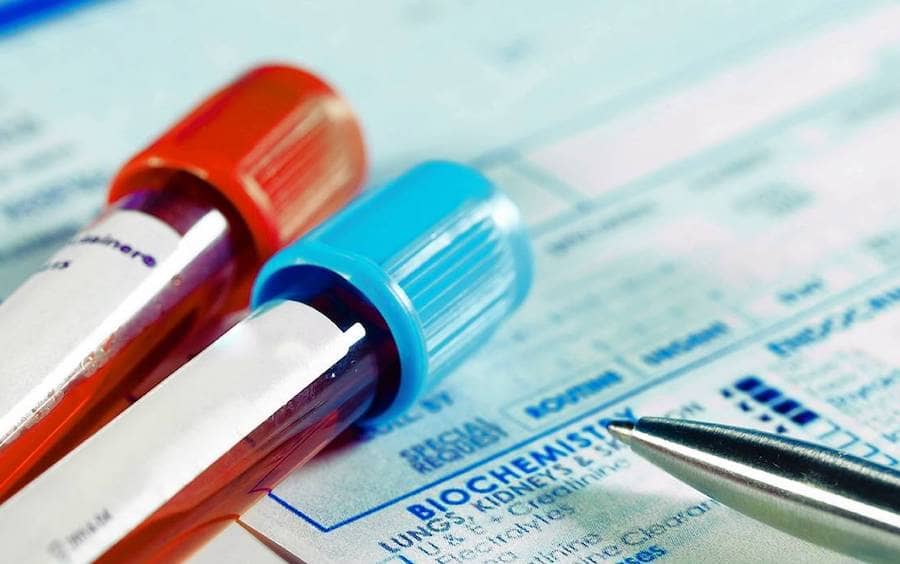
Most people will have blood work done due to some conditions. But when the blood results say that they are normal the patient can feel rather perplexed as their symptoms say they are not healthy. Dr H Rensburg has endeavoured to rectify this problem through explaining how laboratory reference ranges work.
This guide will bring some relief to know that doctors might miss important factors when analysing your blood lab results. It is, however, strongly advised to first speak to your physician before applying any protocols listed below.
Dr H Rensburg
Hormones need to be at youthful levels to function optimally. Individuals between the ages of 20 and 30 who are not taking any medication, do not have any current diseases, and have optimal body fat percentages fit into the healthy range of any lab test. Hormonal levels across a population do not reflect health because they include sick people of all ages.
Outside the Laboratory Reference Ranges
Statistically, a person with their head in an oven and feet in a freezer should be, on average, comfortable. The abdominal area may be comfortable, but both ends may be very sick.
Below and above these statistical lab ranges, disease occurs. Further outside the optimum ranges, the associated disease processes become more pronounced and overt. The laboratory ranges represent the whole population randomly, including various diseased sub-groups. These levels are merely statistical averages and not based on optimum healthy ranges.
Many medical schools only cover the overt deficiencies (oven’) and overt excesses (freezer) of hormones, not the borderline (sub-clinical) excesses and deficiencies. As a result, medical students rarely learn about the physiological effects of hormones. Moreover, since only overt pathological states are considered, anything within these statistical ranges is considered normal, regardless of obvious clinical symptoms.
This over-reliance on the tab ranges has often resulted in the doctor treating the blood test. chasing numbers, and not treating the patient. In addition, some laboratories provide different reference ranges for specific tests.
Some of the critical factors influencing the lab reference ranges, assuming it is a quality laboratory performing the test, include:
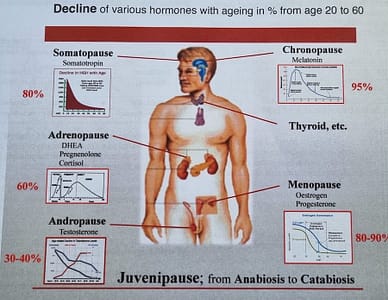
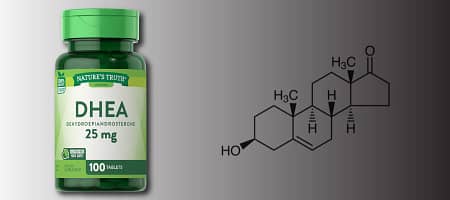
1. Juvenipause and Catabiosis (Ageing), a disease process by itself, decreases the levels of various hormones Therefore, younger people have different ranges than aged persons Thus, a 25-year-old male’s DHEA level of 14.0-270 µmol/L is considered normal. However, on the other hand, in a 60-year-old, these levels would be reported as abnormal. Consequently, many clinicians will interpret it as such based on what the lab reports
2. The health of an individual. Various disease processes can have an impact on the test results To determine normal healthy, and optimum ranges, only include healthy individuals for statistical analysis to determine the healthy youthful ranges. Population statistics is another matter and serves other purposes.
3. Timing. The time of day and month the sample la collected can drastically alter the levels. Some hormones have rhythm variations throughout the day. month and seasons Eg. TSH and testosterone levels are considerably different in the afternoon than in the mornings TSH levels are also different in winter as compared to summer.
4. Stress. Unusual exercise, sexual activity, and anxiety 24-48 hours before the test can affect the levels of certain hormones Stress can artificially increase prolactin and cortisol levels. It is common for men to experience a temporary drop in testosterone levels after sexual activity.
5. Hydration. Concentrated dehydrated, or overhydrated blood may give different values.
6. Fasting. Fasting or non-fasting can have a significant influence on many test results
7. Method. In some labs, the test is performed differently than the best methods available. Moreover, different labs may perform the test differently, making it impossible to compare results between them.
8. The sample of patients on which their tests are based. Doctors typically send patients they suspect to be ill for blood tests Unfortunately, follow-up tests are more likely to show disease, skewing the values further from the ideal healthy ranges
9. Population getting older. As a result, there are more tests conducted on older people, skewing the results even further away from healthy optimal ranges.
An example
As for Thyroid Stimulating Hormone (TSH), laboratories can report a range as wide as 0.4 to 5.5 mU/L as ‘normal’. This range is from one end of town to the other end, and it includes a lot of elderly and diseased Individuals. We live in an ever-increasing ageing population, and relatively more aged people are tested than in the past, further bending the results towards the disease of senescence. In medicine, the wider the range, the less accurate it is
Several years ago, the American National Academy, the American National Academy of Clinical Biochemistry narrowed the reference range for thyroid-stimulating hormone (TSH) from 0.5-5.0 mIU/L to 0.2-2.5 mIU/L. Similar revisions by the American Association of Clinical Endocrinologists (AACE) meant that 13 million people previously considered ‘normal’, could now become officially diagnosed with an under-active thyroid.
Additionally, in the Journal of Clinical Endocrinology and Metabolism 2012, the odds of finding thyroid cancer with a TSH of 3.5 mIU/L or more were three times greater than for someone with 0.1 mU/L. Higher than 2.5 mU/L increases arterial stiffness, which correlates well with cardiovascular disease within the so-called ‘normal ranges’. Since the lab ranges contain values associated with disease risk, they cannot be considered healthy
Testing for optimal healthy ranges
When testing a specially selected sample of healthy individuals like
- youthful between the ages of 20 and 30
- not on any medication and drug-free
- normal weight and fat %
- no active disease processes, thus free from disease
- showing no thyroid problems on thyroid scans
- In most cases, the test is performed in the morning
Under these conditions, their TSH ranges are not between 0.4 to 5.5 mU/L, but between 0.3 and 1.5 mU/L. Quite different ranges.
Why this big difference?
It just demonstrates how ageing and disease can influence reference ranges. Which reference range would you like to be compared to when determining your thyroid status? The labs’ or the levels found in healthy, youthful folks? The latter is only one example, many others exist.
What does it mean to you as an individual?
It is important to remember that lab ranges are statistical values, not necessarily healthy ones.
Many morbidities (disease) and mortality are within these so-called ‘within normal’ reference ranges. Therefore they do not necessarily reflect the healthiest, optimum levels. However, approximately 95% of the population falls within these “normal” lab ranges.
The logical question is: To determine your health status, which reference ranges would you like to be compared with? For example, the lab’s or the levels found in healthy, youthful folks?
You will mainly be prescribed glasses before you become blind, but unfortunately, that does not apply to many other areas of medicine. This is because you must be overtly ill or blind already to get treatment. It is essential to note the difference between lab and healthy reference ranges if you are interested in disease prevention, healthy aging, and healthy living.
Dr. Hendrik in Rensburg
MA MB Bch. BAO (TCD) MRCS (Eng) LR.C.P. (Lond Faculty Member of the International Hormone Society (IHS)